Well-tuned alerts shift teams from reactive firefighting to preventive operations.
Bash + cron + AWS CLI is still a powerful combination for governance automation.
Targeted Terraform changes reduce blast radius during sensitive production updates.
Running production workloads on AWS taught me one lesson repeatedly: reliability is rarely about the headline architectural decisions. It is about the dozens of small, often unglamorous pieces — a disk filling up at 3 AM, an EBS volume without an owner tag, a status check that quietly failed. When these pile up, they erode reliability faster than any single outage.
Over the past several months, I worked on closing some of these operational gaps in our AWS environment. The work involved building custom monitoring around CloudWatch’s blind spots, configuring alerts that actually mean something, and automating the governance work that nobody has time to do by hand. This post walks through what I built, why each piece mattered, and what changed because of it.
The Problem with “Out of the Box”
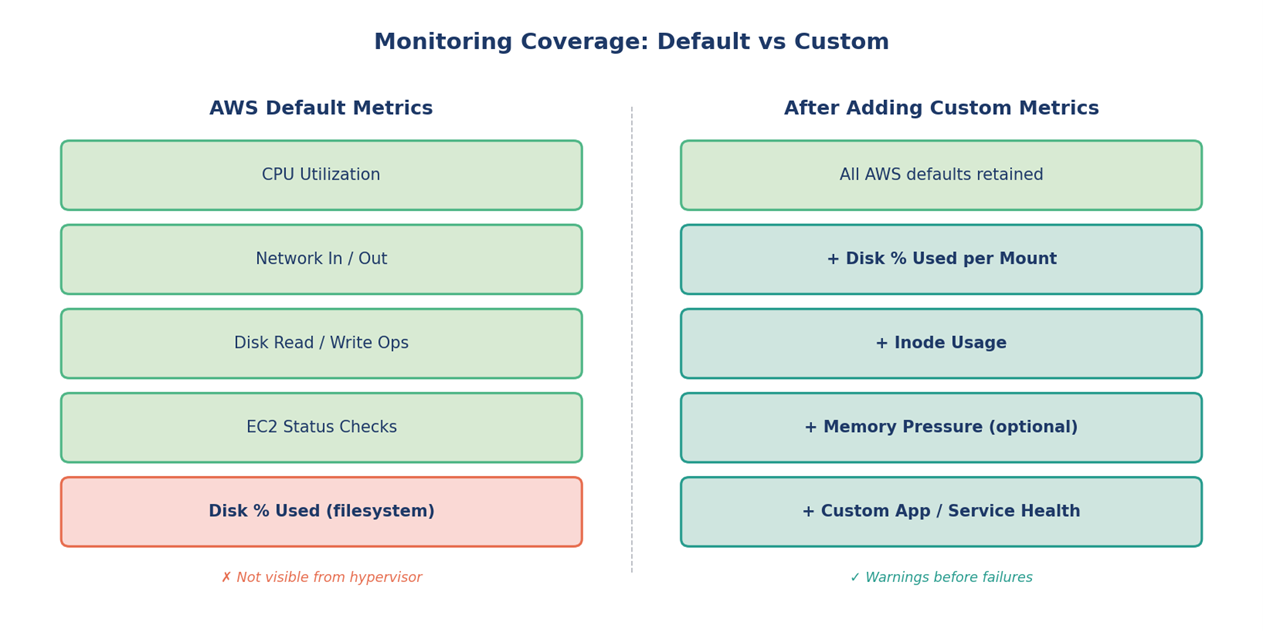
AWS gives you a respectable baseline of metrics for free — CPU utilization, network in/out, disk I/O, EC2 status checks. But anyone who has run EC2 fleets long enough knows the gap: disk utilization at the OS level is not exposed by default. The hypervisor can see your CPU and your network, but it cannot see what is happening inside the volume.
This becomes a real problem with services that:
Write logs to local disk before shipping them to S3 or a log aggregator
Generate temporary files that aren’t always cleaned up
Cache data on the instance’s root volume
Run for weeks without a restart
In our environment, disk-related incidents kept showing the same pattern. The issue wasn’t detected until an application started failing because /var/log was at 100%. By that point the response was already reactive — restart services, prune logs, hope nothing critical was lost.
Figure 1 — What AWS shows you by default versus what custom metrics add.
Building a Custom Disk Monitoring Pipeline
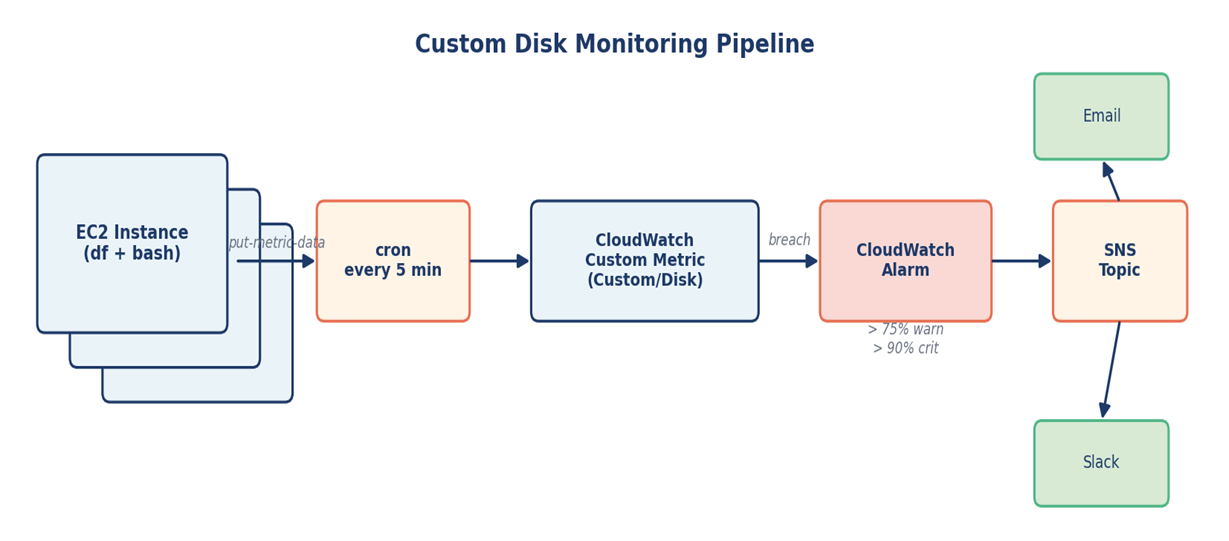
The fix here doesn’t need to be elaborate. CloudWatch supports custom metrics, and you can publish to them from anywhere — including a small shell script running on each instance.
The approach
A bash script reads disk usage with df at a regular interval
The script publishes each mount point as a custom metric under a namespace like Custom/Disk
CloudWatch alarms watch these metrics with sensible thresholds — 75% warning, 90% critical
Alarms route to SNS, which fans out to email and Slack
A simplified version of the metric publish step looks like this:
The CloudWatch Agent is the AWS-recommended path for collecting OS-level metrics today, and it is worth knowing. For environments where rolling out an agent across the entire fleet wasn’t immediate, this lightweight script gave us coverage on day one and remained reliable long-term.
Figure 2 — End-to-end flow from instance to notification channel
The behavior change was immediate. Disk-related pages started arriving at the warning threshold instead of the failure threshold, which gave the on-call engineer time to act with intent rather than scramble at 3 AM.
Making Alerts That People Actually Trust
Building monitoring is the easy part. Making alerts that engineers trust is harder. Two things mattered most in this work.
EC2 status checks
Instance status check failures usually point to underlying host or networking problems that the application layer cannot see. We added CloudWatch alarms specifically for StatusCheckFailed_System and StatusCheckFailed_Instance so that hardware-level issues surfaced before they cascaded into application errors.
Alert fatigue control
Every alert that fires without action erodes trust in the next one. I tested each alarm by deliberately breaching its threshold — filling a test volume, stopping an instance — to confirm it fired correctly and routed to the right channel. Then I tuned evaluation periods and datapoint counts so that transient blips didn’t page anyone.
A practical example: rather than alarming the moment CPU hits 90%, the alarm requires 90% sustained across 3 of the last 5 datapoints. Same threshold, dramatically less noise.
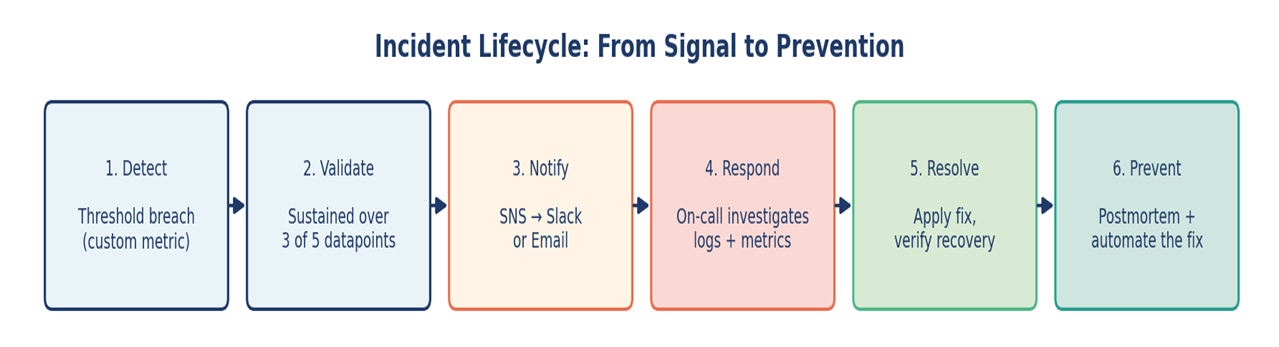
Figure 3 — A useful alert is one stage of a longer lifecycle, not the end of it.
Automating Governance: The EBS Tagging Story
Tagging is one of those things everyone agrees matters and nobody loves doing manually. In our environment, EBS volumes were the worst offender — they would get created, attached, and used for months without inheriting the owner, environment, or cost-center tags from their parent EC2 instance.
This causes real problems:
Cost reports cannot allocate spend correctly
During incidents, nobody knows who owns an orphaned volume
Compliance reviews flag the gap every quarter
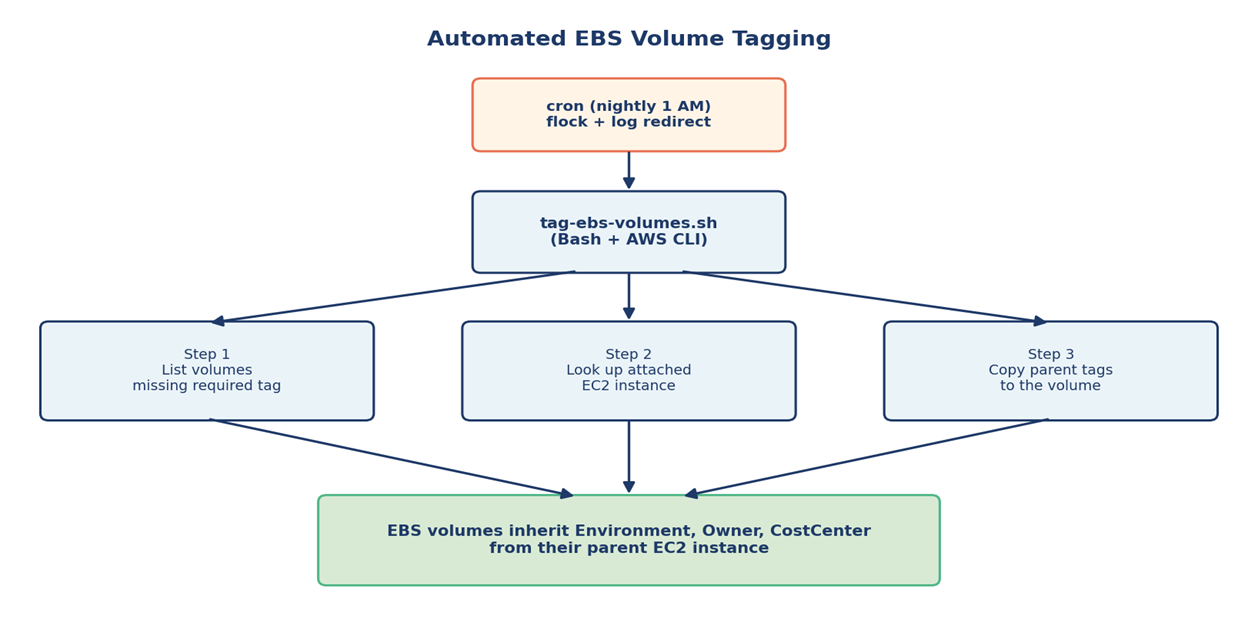
Rather than chase teams to backfill tags, I wrote a Bash script that runs on a schedule and does the work itself. The core idea: find untagged volumes, look up the EC2 instance each one is attached to, and copy the parent’s tags down.
					#!/bin/bash
# Find volumes missing the Environment tag and inherit from parent EC2
set -euo pipefail

aws ec2 describe-volumes --query 'Volumes[].VolumeId' \
  --output text | tr '\t' '\n' | sort > /tmp/all.txt

aws ec2 describe-volumes \
  --filters "Name=tag-key,Values=Environment" \
  --query 'Volumes[].VolumeId' --output text \
  | tr '\t' '\n' | sort > /tmp/tagged.txt

comm -23 /tmp/all.txt /tmp/tagged.txt | while read vol; do
  INSTANCE=$(aws ec2 describe-volumes --volume-ids "$vol" \
    --query 'Volumes[0].Attachments[0].InstanceId' --output text)

  [ "$INSTANCE" = "None" ] && continue

  ENV_TAG=$(aws ec2 describe-tags \
    --filters "Name=resource-id,Values=$INSTANCE" \
              "Name=key,Values=Environment" \
    --query 'Tags[0].Value' --output text)

  aws ec2 create-tags --resources "$vol" \
    --tags "Key=Environment,Value=$ENV_TAG"
done
The script runs nightly via cron. Within a few weeks the gap between tagged and untagged volumes effectively closed, without anyone needing to remember to do it.
Figure 4 — A small bash script, scheduled reliably, replaces hours of manual tagging.
Targeted Terraform Changes for Risk Control
When the infrastructure is already in production, applying a full Terraform plan to fix one resource feels like swatting a fly with a hammer. Even with good plans and reviews, the larger the change set, the larger the surface area for surprises.
For surgical fixes, I leaned on Terraform’s -target flag:
					terraform plan -target=aws_security_group.app_sg -out=plan.out
terraform apply "plan.out"
Use -target sparingly
HashiCorp explicitly recommends using -target only for exceptional circumstances — recovering from mistakes or working around bugs — not as a regular workflow. I treated it the same way: only for incident-response or unblocking situations, always followed by a full plan and apply once the immediate fix was in. Used this way, it is a useful tool. Used as a habit, it leads to state drift.
What targeted changes bought us
A smaller blast radius during sensitive updates
Higher confidence when applying changes inside an active incident
A clearer audit trail — the plan output shows exactly one resource changed
A safer path to rolling back when needed
Scheduling Reliably with Cron
Cron is unglamorous, but it is still the workhorse for scheduled automation on Linux. Two details made the difference between a cron job that quietly works and one that quietly fails.
Logging output
Every script redirects both stdout and stderr to a timestamped log file. When something goes wrong at 2 AM, the logs are already there, ready to be read.
Lock files
A flock-based lock prevents overlapping runs when a job takes longer than its scheduled interval. This matters for the tagging script, which can take several minutes in larger AWS accounts.
					# /etc/cron.d/aws-governance
# Run nightly at 1:00 AM with locking and full log capture
0 1 * * * root /usr/bin/flock -n /tmp/tag-ebs.lock \
  /opt/scripts/tag-ebs-volumes.sh >> /var/log/tag-ebs.log 2>&1
What Changed: Before and After
After several months of these incremental improvements, the operational picture is meaningfully different. The table below summarizes the shift.
Area
Before
After
Disk monitoring
Default metrics only; alerts after failure
Custom CloudWatch metric per mount; alerts at 75% / 90%
Instance health
Issues surfaced via app errors
Status check alarms catch host issues early
Alert quality
Frequent false alarms, fatigue
Tuned evaluation windows, actionable signals
EBS tagging
Inconsistent, manually applied
Auto-inherited from parent EC2 nightly
Risky changes
Full Terraform applies for small fixes
Targeted plans for incident scenarios
Operational toil
High — recurring manual cleanup
Reduced — scripts run on schedule
Lessons Worth Carrying Forward
A few principles stuck with me from this work.
Default monitoring is a starting point, not a destination. Treat it that way.
An alert that doesn’t trigger an action is noise. Tune ruthlessly.
Anything done manually more than three times deserves a script.
Governance scales when it’s automated, not when it’s documented.
Small, targeted changes beat large changes during incidents — every time.
Closing Thoughts
Reliability isn’t a single project; it is a posture. The work described here didn’t transform anything overnight, but each piece — a custom metric, a tuned alarm, a tagging script, a careful Terraform apply — moved the system one step closer to operating predictably. That accumulation, more than any individual fix, is what production reliability really looks like in practice.
Devi Desu
As a CloudOps and DevOps Engineer, I specialize in building and managing scalable cloud-native infrastructure across AWS environment. My experience includes implementing centralized logging and observability solutions using the EFK stack, enhancing production reliability through AWS monitoring and automation, and streamlining cloud operations with modern DevOps and infrastructure automation practices. Passionate about cloud technologies and operational excellence, I continuously work towards building reliable, scalable, and efficient infrastructure solutions for modern applications.
The blueprint for the AI-native enterprise, delivered to your inbox.