Many use high-level tools to track, monitor and control the overall state of their AWS environment. Up until now, these all tools have worked in a polling mode. In other words, they periodically call AWS functions such as DescribeInstances, DescribeVolumes, and ListQueues to list the AWS resources of various types (EC2 instances, EBS volumes, and SQS queues here) and to track their state.
Once they have these lists, they need to call other APIs to get additional state information for each resources, compare it against historical data to detect changes and then take action as they see fit. As their systems grow larger and more complex, the polling and state tracking can become onerous.
It is wired into every supported services and become aware of operational changes as they happen. Then, assigned by your rules, it activates functions and send messages to respond to the environment, make changes, capture state information or take corrective action.
Amazon CloudWatch monitors the AWS cloud resources and also the cloud-powered applications. It tracks the metrics so that you can visualize and review them. You can also set alarms that will fire when a metrics goes beyond a limit that you specified. CloudWatch gives you visibility into resource utilization, application performance, and operational health.
Route your operating system, application and custom log files to CloudWatch, where they will be stored in durable fashion for as long as you’d like. You can also configure CloudWatch to monitor the incoming log entries for any desired symbols or messages and to surface the results as CloudWatch metrics.
You could, for example, monitor your web server’s log files for 404 errors to detect bad inbound links or 503 errors to detect a possible overload condition. You could monitor your Linux server log files to detect resource depletion issues such as a lack of swap space or file descriptors. You can even use the metrics to raise alarms or to initiate Auto Scaling activities.
CloudWatch generally work with below basic terminology.
- Log Event –Log event is an activity recorded by the application or resource that is being monitored.
- Log Stream – Log Stream is a sequence of log events from the same source.
- Log Group –Log Group is a group of log streams that share the same properties, policies and access controls.
- Metric Filters – The metric filters lets CloudWatch know how to extract metric observations from ingested events and turn them into CloudWatch metrics.
- Retention Policies – Retention policies determine how long events are retained. Policies are assigned to log groups and apply to all of the log streams in the group.
- Log Agent – You can install CloudWatch Log Agents on your EC2 instances and direct them to store Log Events in CloudWatch.
Lets’ see how to monitor the logs of EC2 Instance.
How to configure real time log monitoring with AWS CloudWatch
Installing Cloud Log Agent on server:
For installing Cloud Log we need setup s3 permission in IAM (Identity Access Management ).
wget https://s3.amazonaws.com/aws-cloudwatch/downloads/awslogs-agent-setup-v1.0.py
Run script which you have already downloaded.
Path of log file to upload [/var/log/messages]: (Enter the log which you need to monitor)
Destination Log Group name [/var/log/messages]: (Enter the name of log file)
Choose Log Stream name:
1. Use EC2 instance id.
2. Use hostname.
3. Custom.
Enter choice [1]:
Choose Log Event timestamp format:
1. %b %d %H:%M:%S (Dec 31 23:59:59)
2. %d/%b/%Y:%H:%M:%S (10/Oct/2000:13:55:36)
3. %Y-%m-%d %H:%M:%S (2008-09-08 11:52:54)
4. Custom
Enter choice [1]: 1
Choose initial position of upload:
1. From start of file.
2. From end of file.
Enter choice [1]: 1
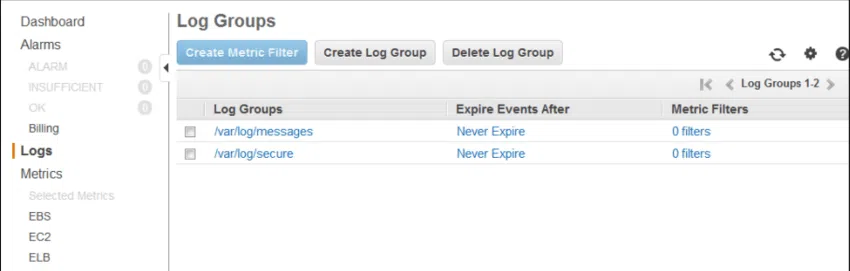
The Log Groups are visible in the AWS Management Console a few minutes later:
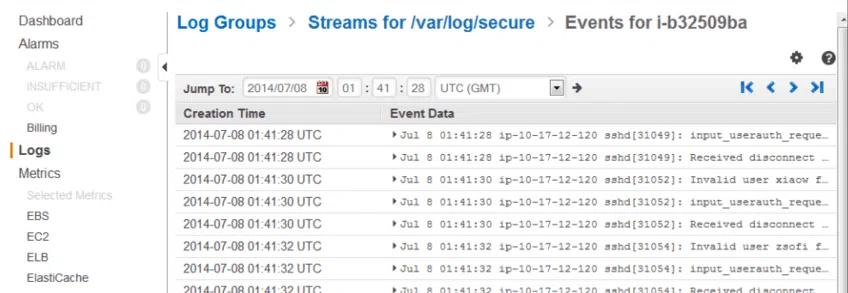
Since we installed the Log Agent on a single EC2 instance, each Log Group contained a single Log Stream. As specified when installed the Log Agent, the instance id was used to name the stream:

The Log Stream for /var/log/secure was visible with another click:
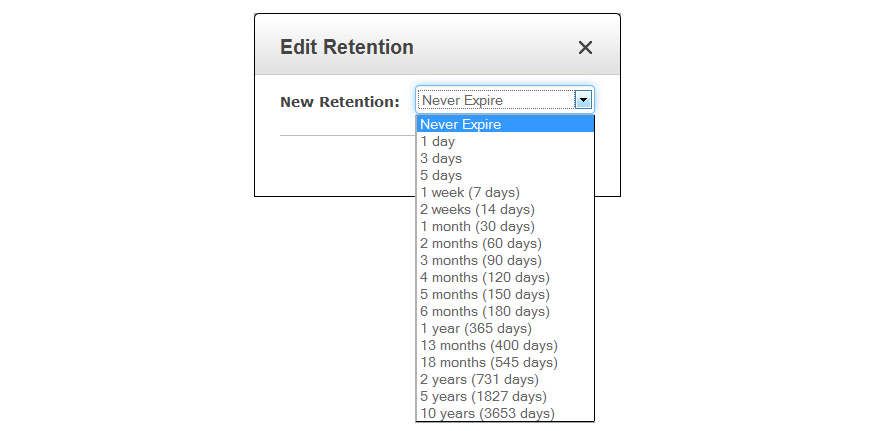
Also you can set the retention period of the logs event.
Now, let consider the case that we need to save the log in s3 bucket.
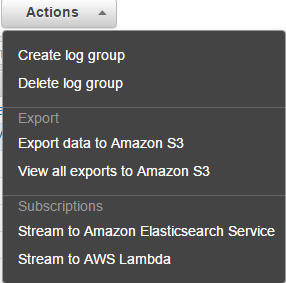
Select the log group you need to export to s3.
Click on action and select the “Export data to s3”
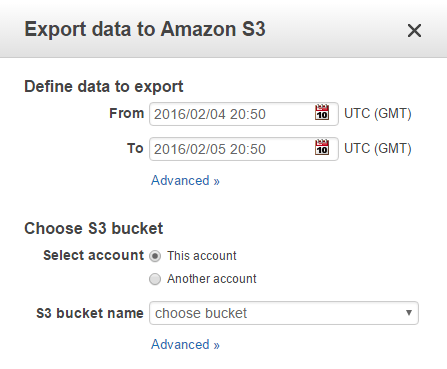
Select the bucket name and then click on “export data”
There are many more features of AWS CloudWatch l to collect and track metrics, collect and monitor log files, set alarms, and automatically react to changes in your AWS resources.
CloudWatch to gain system-wide visibility into resource utilization, application performance, and operational health. You can use these insights to react and keep your application running smoothly.