Skip links

Dashboards as a Code: Automating Grafana Dashboard Management Across Environments

  • Grafana dashboards managed as code enable version control and consistent environments.
  • CI/CD pipelines automate dashboard review and deployment.
  • Templates allow reusable and easier dashboard management.

It might be possible to handle Grafana dashboards by hand when you are starting out, however, as your organization grows bigger and your monitoring requirements become more complex, this method quickly becomes unworkable. You have different dashboards for different environments, no change log, and the perpetual trouble of making sure everything is up to date. This is where CI/CD for Grafana becomes essential, changing the way we handle observability infrastructure.

Why Grafana Needs CI/CD

Think about a scenario where someone unintentionally changed the critical dashboard in production, or when you had to replicate a dashboard in multiple environments. This is common in manually managed Grafana environments. If you consider your Grafana configurations as code and couple them with your CI/CD pipeline, you acquire not only a few conveniences but also a multitude of other advantages.

Version control acts as a safety net. Every change of a dashboard, data source, or alert is recorded, assigned to a user, and can be reverted if necessary. When someone is wondering why a panel was removed from a key dashboard three months ago, instead of making a guess, you can check the Git history.

Maintaining the same dashboard across different environments is not a dream anymore. Development, staging, and production environments can share the same dashboard definitions, only the data sources being different. There are no more questions about why the production dashboard looks different from the one you tested in staging.

The collaborative feature changes the way teams work with each other. Changes to the dashboard go through pull requests wherein team members can review, comment, and suggest changes before the production environment gets the update. This peer review process is very effective in catching mistakes at an early stage and sharing knowledge with the whole team.

The Observability as Code Movement

Industries have been shifting their focus towards codifying everything, and the observability infrastructure has not been an exception. Grafana figured out this trend and with their 12th version, they released a complete set of programmatically designed tools for the management of Grafana resources.

This shift reflects a broader trend: treating infrastructure as code. It is about applying the same rules and methods, which we usually use for application code, to our monitoring infrastructure. Your dashboards, when they are code, can be tested, reviewed, and deployed just like your applications through the same pipelines.

Managing Multiple Environments

It is hardly ever the case in the real world that only one Grafana instance is deployed. Most of the time, there are development, staging, and production environments that require slightly different configurations while being consistent in their structure.

The problem is how to handle these differences without repeating the code. Template based solutions are perfect for this case, where a base dashboard is defined and placeholders are used for the environment, specific values like data source names, alert thresholds, or refresh intervals. Each environment’s configuration files list the values for the placeholders. The pipeline, during the deployment, picks up the right configuration file depending on the target environment and completes the template.

Dashboard Templatization and Reusability

One of the most potent things for treating dashboards as code is the capability to make reusable components. Instead of creating similar dashboards from the scratch for different services or teams, you make parameterized templates that create several dashboards from one single definition.

Let’s say you have twenty microservices, each requiring a similar dashboard that displays request rates, error rates, and latency. It would be better to create one template that takes the service name as a parameter and generates the correct queries and visualizations rather than managing twenty almost identical dashboards.

This approach significantly reduces maintenance effort. The moment you decide to add a new panel or change a threshold, you only need to edit the template, regenerate the dashboards, and run your CI/CD pipeline to deploy. There is no need for manual intervention, and thus all twenty dashboards update consistently.

Also, the same rule is valid for the panels in the dashboards. Easily understood through examples, error rate graphs or resource utilization metrics which are common can be turned into reusable functions that you call with different parameters.

Architecture of a Grafana CI/CD Pipeline

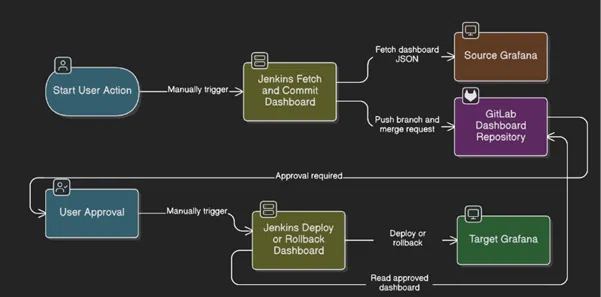
The workflow orchestrates several key technologies:

Jenkins functions as the automation engine that controls two different pipelines for dashboard fetching/committing and deployment handling.

There are two different environments for Grafana instances:

A source instance where dashboards are created and tested, and a target instance where dashboards are deployed or rollbacked. GitLab acts as the version control system where all dashboard changes are tracked and it is also the single source of truth for all dashboard configurations.

Architecture of a Grafana CI/CD Pipeline

Stage 1: Dashboard Extraction and Version Control

The process starts when a user manually triggers the fetch pipeline in Jenkins. This manual trigger is a deliberate action that ensures that only those changes which are intentional go through the workflow, thus accidental overwrites or configuration drift are avoided. Jenkins connects to the source Grafana instance through the REST API and retrieves dashboard definitions in JSON format.

These JSON files are the complete specification of the dashboard showing the panels, queries, variables, and visualization settings. The pipeline then commits these files to the GitLab repository thus creating a history that can be audited for all the modifications made to the dashboards. At the same time, the pipeline commits the changes to a branch and opens a merge request. This step by itself places a review gate in the path of what could be a fully automated process without any intervention.

Stage 2: Human Approval Gate

The merge request waits for approval which means that the user has not yet approved it. The checkpoint is a physical thing that comes from different aspects. Once a designated approver has gone through the merge request and given the green light, the workflow moves on to the deployment stage.

Stage 3: Deployment Execution

The user, after getting the approval, manually initiates the deployment pipeline in Jenkins. This second manual initiation is a kind of extra safety measure which enables the teams to be in control of the deployment timing from an operational point of view, for example, during a maintenance window or a change freeze.

The deployment pipeline fetches the dashboard configuration that has been approved from GitLab and makes the necessary changes to the target Grafana instance. The pipeline is equipped with rollback features, thus enabling fast rollback in case the deployed dashboard behaves abnormally or leads to performance issues.

Conclusion

This workflow shows how CI/CD principles can effectively manage observability infrastructure and observability devices. By considering dashboards as code and putting them under the control of versions and review processes, the teams get the advantages of GitOps while still being able to have the suitable human supervision of the changes in the environments. The outcome is a monitoring infrastructure that changes in a secure and open way together with the applications that it is monitoring.

This website uses cookies to improve your web experience.
Home
Account
Cart
Search