
Many organizations invest a significant amount of money in attracting customers, expecting them to spend with the organization for years. Organizations expect to earn more profit from retaining these customers. Retention can be measured qualitatively by talking and checking in with your customers regularly, so you’ll know what their main needs and issues are, and when they occur. Retention can also be quantified, giving you hard data on how much money you’re losing. Typically this is done using a Cohort analysis.
Cohort analysis is a subset of behavioral analytics that takes data from a given eCommerce platform, web application, payment system, CRM or online game and rather than looking at all users as one unit, it breaks them into related groups for analysis.
A cohort is a group of users who share a common characteristic during a particular time period. Cohort analysis is looking at the retention of those users over time. The importance of cohort analysis is that you’ll not only see that customers leave and when they leave, but you can also know why they are leaving the organization. By resolving the issues proactively, churn rate can be minimized.
For example, if you have a music app, all music app users have a lifespan, and these lifespans express a trend to make conclusions. When you see changes in user behavior from optimizing the use of various features, you’ll often find that the trends or changes are too weak to draw any conclusions. This occurs when your user behavior is varied in the usage of an app with different levels of engagement and at different stages in a user lifespan.
Cohort analysis is designed to solve this problem. Cohorts are great for showing trends and telling you when people are churning. You can segment the customers when they start using the app. A cohort will be a group of users who do certain actions within a time-frame that you specify, for example, within the first 3 days of app user. And cohorts can be broken down by the day they signed up and monthly cohorts can be tracked. By measuring the retention of these cohorts, you can see how long people continue to use the app from their initial start point. You can then look at how long different cohorts stay active in your app after they perform those actions.
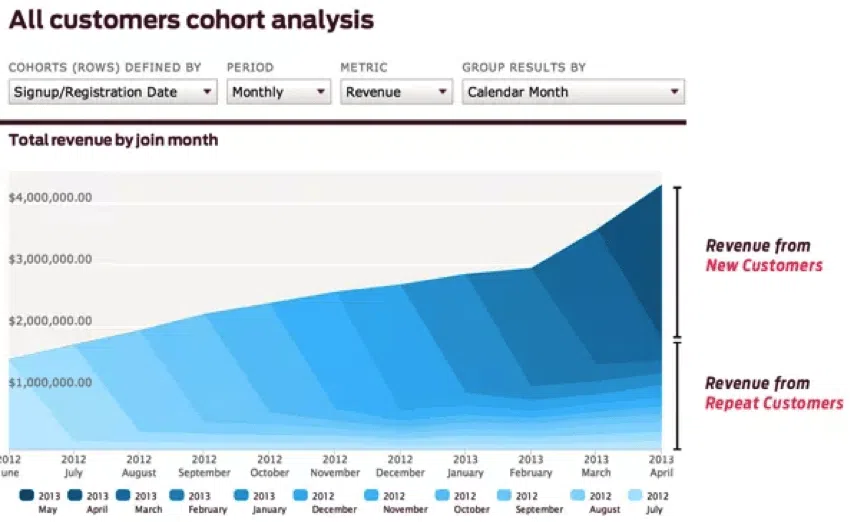
Insight into the company revenue in the layer-cake graph Music app users can be NEW or the users can be REPEAT. Layer-cake graph which is produced by cohorts will give clear insights of your business by showing the percentage of your revenue or profit came from new vs. repeat users at a given point in time. By tracking how the ratio has changed over time, can give you insights into whether you are in top line growth because of the new customer acquisition or through continuing with your existing users over time.

Anblicks is a Data and AI company, specializing in data modernization and transformation, that helps organizations across industries make decisions better, faster, and at scale.