Skip links

How Can You Monitor Streaming Logs with Frontail

Monitoring logs have been an integral part of troubleshooting or debugging in applications. So, when we look from a developer’s perspective, especially from DevOps and CloudOps teams, it is easy for them to view the logs and have access to almost all the servers. But, what if personnel who is not an expert in DevOps or CloudOps? Will it be as simple for them to maintain the logs? Maintaining logs becomes a tedious task as they always must rely on the Infra team. But it’s an old saying that “for every problem where is a solution.”

System and Application Logs_Image
System and Application Logs

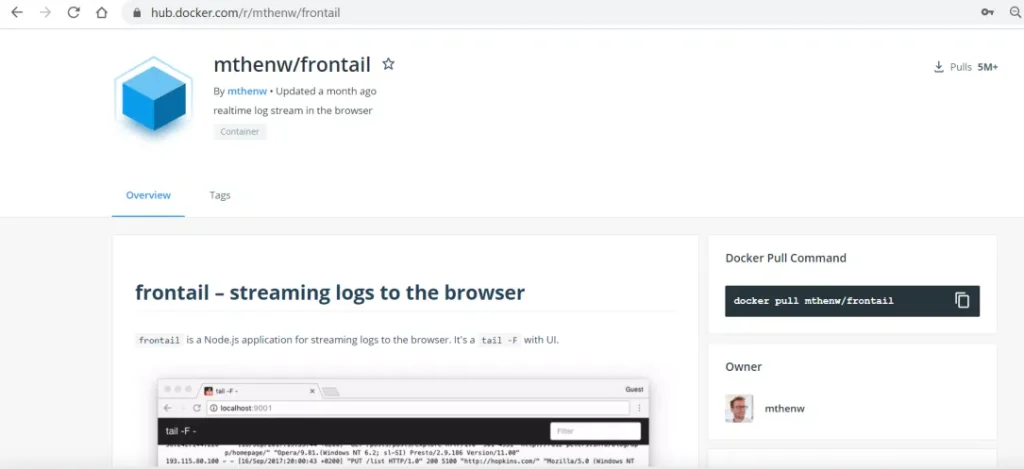
So today to address this issue we are going to talk about the solution to view logs directly from a browser. And to add, all the logs are configurable.

What is Frontail and What are its Features?

Frontail is such a tool, which can be used in various ways and ease the work for the developer as they do not have to approach or raise a ticket to the IT team. Now let have a glance at the features that Frontail offers to the developers:

  • Log rotation (not on windows!)
  • Auto-scrolling
  • Marking logs
  • Pausing logs
  • Number of unread logs in favicon
  • Themes (default, dark)
  • Highlighting
  • Search (Tab to focus, Esc to clear)
  • Set filter from URL parameter filter.
  • Tailing multiple files and stdin
  • Basic authentication

Since we now know that what Frontail is? Let’s have a look at how one can use the tool to view the logs directly from the browser. We have two approaches for doing so. One is manually configuring the Frontail using the npm package, and another is using the containerized approach.

Note:

By default, frontail (from v4.5.0) collects anonymous usage statistics in Google Analytics. One can disable with flag “–disable-usage-stats.” So, to begin with, the configuration will start with Docker way as it is a single-line command.

Docker:

Docker Hub-Public Repository_Image
docker run -d -P :9001 -v /var/log:/log mthenw/frontail /log/syslog
Note:

default port is “9001”

Case study: How Leading Software and Data Analytics Provider Modernized Its ETL and Data Warehouse?

Download Now

NPM:

As we know that npm is a package manager for Javascript programming language, you can implement the package by 1st. Download a binary file from the Releases page (currently frontal does not work on Windows) OR 2nd. One can install from npm package “npm i frontail -g”. 3rd. frontail /var/log/syslog 4th. visit http://localhost:9001 Please note that the web interface runs on HTTPS i.e https://cloudopsdemo.anblicks.com/livelog/

Tailing Multiple Files

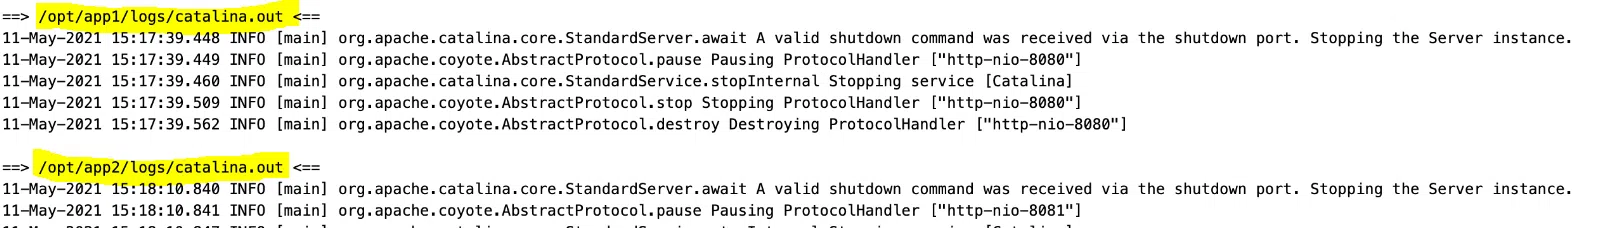
[file …] accepts multiple paths, *, ? and other shell special characters(Wildcards, Quotes, Back Quotes, and Apostrophes in shell commands). If you want to stream real-time logs with the two different log files, it will be the possible Frontail application.

frontail --disable-usage-stats --ui-highlight --ui-highlight-preset /usr/lib/node_modules/frontail/preset/default.json --lines 2000 --number 200 "/opt/app1/logs/catalina.out" "/opt/app2/logs/catalina.out" --url-path /livelog &
Streaming Logs of Multiple Files_Image
Streaming Logs of Multiple Files

Running behind nginx

This can run behind proxy such as nginx. Use the –url-path option with the example configuration.

server {
listen                          80;
server_name                     cloudopsdemo.anblicks.com;
}
server {
listen                   443 ssl;
server_name     cloudopsdemo.anblicks.com;
ssl_certificate /etc/ssl/certs/anblicks.crt;
ssl_certificate_key /etc/ssl/certs/private.key;

location /livelog {
proxy_set_header X-Real-IP $remote_addr;
proxy_set_header X-Forwarded-For $proxy_add_x_forwarded_for;
proxy_set_header Host $http_host;
proxy_set_header X-NginX-Proxy true;
proxy_pass  http://127.0.0.1:9001/livelog;
proxy_redirect off;
proxy_http_version 1.1;
proxy_set_header Upgrade $http_upgrade;
proxy_set_header Connection "upgrade";
}
}

Example: –url-path /frontail Streaming and monitoring of the log has become a crucial task for businesses today. However, the sheer amount of data and log entries make it daunting for the developers to monitor every log. Nevertheless, with the help of Frontail, developers can monitor the logs without raising an additional ticket or issue in the system. So, if you are willing to implement a solution that can monitor your logs in real-time.

Let’s connect.

This website uses cookies to improve your web experience.