
An Introduction to Outliers – What are Outliers – Types of Outliers
What are Outliers?
Outliers are a very important aspect of Data Analysis. This has many applications in determining fraud and potential new trends in the market. In purely statistical sense, an outlier is an observation point that is distant from other observations. The probably first definition was given by Grubbs in 1969 as “An outlying observation, or outlier is one that appears to deviate markedly from other members of the sample in which it occurs”.
Outliers are different from the noise data.
- Noise is random error or variance in a measured variable
- Noise should be removed before outlier detection
An outlier may indicate an experimental error, or it may be due to variability in the measurement.
In data mining, outlier detection aims to find patterns in data that do not conform to expected behavior. It is extensively used in many application domains such as
- Fraud detection for credit cards, Insurance, and Healthcare
- Telecom fraud detection
- Intrusion detection in cyber-security,
- Medical analysis
- Fault detection in safety-critical systems
Case Study: How can you Reduce Operating Cost and Enterprise Risk by using Artificial Intelligence
Outliers can be classified into three categories:
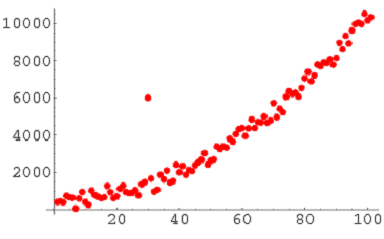
Global Outlier (or point outliers): If an individual data point can be considered anomalous with respect to the rest of the data, then the datum is termed as a point outlier. For example, Intrusion detection in computer networks.
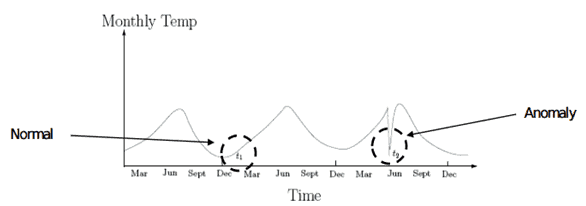
Contextual outliers: If an individual data instance is anomalous in a specific context or condition (but not otherwise), then it is termed as a contextual outlier. Attributes of data objects should be divided into two groups
Contextual attributes: defines the context, e.g., time & location
Behavioral attributes: characteristics of the object, used in outlier evaluation, e.g., temperature
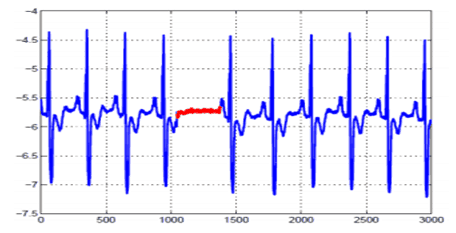
Collective outliers: If a collection of data points is anomalous with respect to the entire data set, it is termed as a collective outlier. There are three approaches for outlier detection:
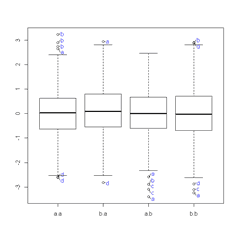
Statistical Method: Identifying an observation as an outlier depends on the underlying distribution of the data. Here we focus on univariate data sets that are assumed to follow an approximately normal distribution. The box plot and the histogram can also be useful graphical tools in checking the normality assumption and in identifying potential outliers. It is common practice to use Z-scores or modified Z-score to identify possible outliers. Grubb’s test is a recommended test when testing for a single outlier
Supervised outlier detection: Techniques trained in supervised mode assume the availability of a training data set which has llabeled instances for normal as well as outlier class. The typical approach in such cases is to build a predictive model for normal vs. outlier classes. Any unseen data instance is compared against the model to determine which class it belongs to.

Unsupervised Outlier detection: It detects outliers in an unlabelled data set under the assumption that the majority of the instances in the dataset are normal by looking for instances that seem to fit least to the remainder of the dataset.

We will explore this very important Data Science method in subsequent blogs.

Anblicks is a Data and AI company, specializing in data modernization and transformation, that helps organizations across industries make decisions better, faster, and at scale.

