Amazon Q connects logs, metrics, deployments, and infrastructure data to accelerate root cause analysis.
It helps teams identify incidents and IaC issues faster through cross-domain reasoning and automation.
The biggest impact is reducing troubleshooting time and improving DevOps efficiency.
Over the past few years, we have seen tremendous growth in DevOps tools. For instance, CI/CD pipelines have made it easier to deliver software – tasks that used to take days can now be done in minutes with just one commit. Infrastructure as Code has also allowed us to set up the same infrastructure across multiple environments consistently.
Engineers now have the ability to see into the operations of their applications through advanced observability platforms that could have only been imagined ten years ago. Yet, whenever any alert fires or an incident occurs, someone opens the metrics dashboard, someone checks the logs in the terminal, someone scrolls through the recent deployments, and someone checks any recent changes in the infrastructure.
Each tool generates its own data, but they don’t really talk to each other. This means that developers have to act as the bridge between these tools, manually trying to connect the dots between logs, metrics, deployments, and infrastructure changes to find the root cause of the problem. Most processes have been automated using DevOps; however, we still have room for improvement when it comes to automating our ability to reason through the cause of incidents and alerts. This is where Amazon Q comes into the picture.
Amazon Q: More Than an AWS Chatbot
As soon as people hear the name “Amazon Q”, they start thinking of it as some chatbot functionality with extension onto AWS. Amazon Q is one of two product groups offered by AWS with the lines of products serving a different audience. Amazon Q Business focuses on enterprise knowledge management solutions that help organizations find and query their internal data, while Amazon Q Developer makes things to start getting interesting from an engineering team’s standpoint. The thing which sets it apart from other tools isn’t some novel capability. It’s scope.
Tool
What It Actually Sees
CloudWatch Monitoring
Metrics, thresholds, and alerts — in isolation
Log aggregator
Application and system logs — in isolation
CI/CD platform
Pipeline state and deployment records — in isolation
IaC tooling
Infrastructure configuration — in isolation
Amazon Q Developer
All the above with the connections drawn between them
When you use Amazon Q Developer, it simultaneously interacts with multiple data domains across querying multiple datasets. When comparing the use of the Amazon Q Developer to that of a chat interface, coding suggestions, or any other type of interface, this is where it gets exciting for engineers. The cross-domain reasoning is what matters.
How Amazon Q Turns Context into Answers
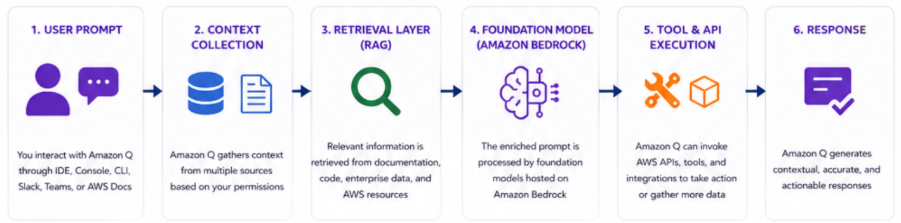
There are several stages from your prompt processing to routing it to underlying model and receiving a response back from it.
User Prompt Intake with Environmental Context: When you plug a prompt into Amazon Q, it does more than evaluate your words; it also evaluates where you are when you enter those words with their respective context – where you are asking from and what is around you. Amazon Q uses this information to determine what you are asking. Before an input is submitted to a target language model, the model will look for conditions which may exist related to the input such as other resources available to the target model. It will consider what resources are currently in use, current state of an infrastructure, current workspace layout, and make use of these resources to send an appropriate message. Because it will analyse the surrounding environment as well as use that data to inform the message sent to the language model; this ability to take into account the environmental context surrounding all of the resources makes Amazon Q different from any other general-purpose AI assistant with access to the AWS data.
Retrieval-Augmented Generation: When Amazon Q receives an instruction to respond to a request, it will perform an initial step where the model will perform a retrieval to search for all documentation and sources of information linked to AWS and the context of your application. This matters a lot for accuracy, particularly on infrastructure-specific questions where details change over time.
Foundation model inference on Bedrock: The enriched prompt goes to a foundation model running on Amazon Bedrock, which handles the underlying hardware, model serving, and governance layer. Amazon Q is a layer above Bedrock where the assembly of the context occurs, and below Bedrock, the inference takes place. The model does the reasoning, code generation, summarization, and analysis on the assembled context.
Tool and API execution: This is where Amazon Q crosses the line from “assistant” into “agent.” It can call AWS APIs. It can trigger analysis workflows, pull log data, examine infrastructure state. Most importantly, it can also take action, not just describe what could happen, which leads to a distinction of being able to perform an action on its own versus simply being able to provide a smart autocomplete function.
Situations Where This Makes a Difference
Capabilities sound trivial when described theoretically. Here are some practical scenarios for which Amazon Q’s utility won’t be hypothetical anymore.
Scenario 1: The Increase in Latency That You Likely Didn’t Know About
Suddenly on a Wednesday evening, there has been an increase of 40% in the p99 latency of your checkout API over the last two hours. No alert fires. From a purely technical standpoint, things are fine and dandy; SLA is in place. Yet you get a ticket about poor checkout performance, you are paged, and you stare at the dashboards, where all you can see are the numbers that are just fine. In the absence of any cross-layer visibility, your diagnosis will involve: checking CloudWatch, examining latency, observing high memory usage, moving to your log management solution, filtering errors by time span, seeing the garbage collection overhead being higher, and, lastly, checking pipelines where you noticed that there was a deployment at 4:45 PM, and the serialization of objects could have some problem. With Amazon Q, the engineer only asks one question that what has been altered in the environment between 4 p.m. and 6 p.m. that could have caused this anomaly in latency? And the Amazon Q will answer that: “There was a deployment at 4:45 pm. Serialisation was altered by the developer. GC pauses correlated to the serialisation problem and latency spike kicked off around ninety minutes after deployment”. But it’s the engineer who makes the decision on whether he or she should roll back or push a targeted fix. And Amazon Q isn’t going to decide for you, but it will provide you with a solid base to start your troubleshooting from.
Scenario 2: Catching IaC Misconfigurations Before They Reach Production
An application server environment is launched via Terraform. The IaC script is checked over, and it looks fine – the right instances are used, correct IAM roles assigned, proper security groups setup. There are two small details overlooked: there’s an aggressive autoscaling cooldown setting for the application traffic, and one of the security group rules allows a wider range of ports than intended. Neither is problematic from the get-go, but after a couple of weeks, issues start surfacing – traffic spikes don’t provide stable performance, and this is attributed to ‘traffic variability’ for a further three weeks. Meanwhile, the security group rule remains dormant, until it causes any trouble. Amazon Q reviews IaC scripts for problems before their launch, and spots both these issues. The former is presented with context – based on your application traffic patterns, you’ll likely experience thrashing due to the autoscaling cooldown settings when you hit the evening traffic spike. The latter is reported with the specific port range highlighted and why it’s different from your standard configuration.
Where Does Amazon Q Sit in Your Stack?
A question we get a lot: Is it replacing anything else that I already have for observability? No, it’s not. Instead, view Amazon Q as a reasoning layer that sits on top of your various data layers. Your monitoring solution keeps capturing the metrics. Your logging solution continues to aggregate your logs. The CI/CD system will automatically keep managing the pipeline state for you. But Amazon Q eats it all up – with no storage and without replacing your monitoring stack, which is important, since the value delivered by Amazon Q is limited by what it is consuming. That said, this needs to be acknowledged upfront, as it dictates how you should be prioritizing investments:
What you need in place
Why it matters
Structured, consistent log formatting
Makes cross-service log correlation meaningful instead of noisy
Properly tagged and labelled metrics
Allows accurate attribution of performance changes
Recorded deployment history
Enables the change-to-symptom correlation that makes incident response faster
IaC templates in version control
Makes infrastructure configuration analysis possible
Documented service dependencies
Helps identify incident blast radius more accurately
Highly observable teams will gain much more value from Amazon Q than teams that use Amazon Q as a means of addressing issues with their own observability systems. They won’t be able to. Reasoning on good data begins with collecting the data. The upside? Bringing Amazon Q into your tooling stack tends to reveal problems with data quality that you had no need to consider previously because you didn’t have any reason to connect the dots.
Start With Your Cleanest Data Sources
Your initial integrations should focus on the data streams where you already have things well-organized. That means connecting to your CloudWatch metrics, your CloudTrail events, and your CI/CD pipeline for organisations that are AWS-based. This is what allows you to verify whether any insights offered by the software really make sense.
Bring In the Application Layer
With your baseline integration well understood, introduce application logging and distributed traces. It’s here where incident correlation starts becoming interesting, with the ability to correlate behavior in the infrastructure layer with behavior in the application layer – and the latter is usually where the meat of the problem resides. Expect log quality problems in this step – inconsistent formatting, lack of context in log messages, and so on. Just think of it as an opportunity for feedback – not something that is a product of Amazon Q.
Extend Into Development Workflows
After your operational integration has been done properly, the next thing to do would be to extend it into development – working code (IaC templates) still in development, Pull Requests, test coverage trends, etc. This will help you catch potential problems even before they make it to the staging environment. Catching an operational problem via a code review is much less expensive than doing so via a production incident.
How to Know If It’s Actually Working
Any expenditure on operations instrumentation must have meaningful KPIs to compare it against. And here’s what those KPIs ought to be — including one specific KPI that almost everyone seems to neglect.
Metric
What it's actually telling you
Mean time to hypothesis (MTTH)
How long from alert to a testable explanation — this is the number most directly affected by Amazon Q
Mean time to resolution (MTTR)
End-to-end resolution time — affected by many factors, but should trend down
IaC misconfigurations caught pre-deployment
Whether pre-deployment review is genuinely catching risk
Build time trend over rolling quarters
Whether CI/CD degradation is being caught and reversed before it becomes chronic
MTTH needs to get more focus than it currently gets. The KPI that is measured by most teams is MTTR, but there are many external factors which influence it, such as the complexity of the problem itself, whether the right person was available, release intricacies and other factors. On the contrary, MTTH zeroes in on what contextualization can do for you – the time between “there is an incident” and “we know what caused it.”
The Real Value of Amazon Q
This is what I want you to take away from the blog. Amazon Q is not about the issue of technological prowess, but about the issue it aims to tackle. Logging, Monitoring and CICD tooling has gotten significantly better too. The point is that each of these tools creates the signal itself. But it takes human brainpower to process all these signals to form a coherent view, and to do so under extreme time constraints, late at night, and without complete information. Specifically, it has traditionally required the efforts of whatever individual happened to be handling the pager or had the sharpest pattern recognition that evening. That is where Amazon Q shines.
This will happen to you, however, only if it is something you have control over: the quality of your data, the thoughtfulness of your integration, and giving engineers enough room to really learn how to use the tool without making them do everything with it right from the start. The 2 a.m. incident is not going away. What changes is how fast you move from “something is broken” to “here is why” — and that is where the real ROI lives. If you’re running workloads on AWS and want to explore how Amazon Q Developer fits into your stack, the AWS documentation is a solid starting point.
Roopang Mody
Roopang Mody is Program Manager at Anblicks, with extensive experience in CloudOps, DevOps and AI-driven infrastructure. He drives end-to-end delivery of complex and cross-functional technology initiatives. He is specialized in bridging engineering and business stakeholders, managing program roadmaps, dependencies and risks across Cloud infrastructure, DevOps processes and AI/ML platforms. He regularly works at the intersection of platform engineering and modern cloud-native solutions, ensuring technical complexities into clear outcomes, teams deliver scalable and reliable solutions aligned to organizational priorities.
The blueprint for the AI-native enterprise, delivered to your inbox.