From Automation to Intelligence — How Organization can learn from their decisions managing Institutional Memory Loss?
Why Most Enterprises Never Become Truly Intelligent?
Over the last decade, enterprises have invested millions in ERP modernization, cloud data platforms, forecasting engines, AI pilots, and BI dashboards.
Yet if you walk into most organizations during peak season, you will still see spreadsheets, escalation emails, war-room meetings, and manual overrides.
This is not a technology failure. It is a maturity ceiling.
Most companies automate tasks. Very few redesign how decisions are made, executed, and learned from.
An Intelligent Enterprise is not one that predicts better.
It is one that:
- Makes decisions with context
- Executes within governance
- Learns from outcomes structurally
To make this practical, let’s use a single process area as an example.
The Use Case: Apparel Demand Planning
Retailer: OmniRetailCo
Product: Women’s Black Relaxed Hoodie
Stores: 100
Planning Period: Week 39 (early fall ramp-up)
The business question:
How many hoodies should we buy and allocate next week?
We’ll walk through five maturity levels using this one decision.
Level 1 — Reactive Planning (Historical Guesswork)
How It’s Done Today?
A planner exports last year’s Week 39 sales from ERP into Excel.
Last year, the hoodie sold:
| Week | Unit per Store |
|---|---|
| W39 | 80 |
The planner assumes 10% growth.
| Metric | Value |
|---|---|
| Last year sales/store | 80 |
| Growth assumption | +10% |
| Planned units/store | 88 |
| Total units (100 stores) | 8,800 |
The plan is emailed and manually entered into ERP.
What This Solves?
- Introduces discipline
- Anchors decisions to history
- Enables vendor commitments
What It Introduces?
As SKUs and store counts grow:
- More styles
- More sizes
- More promotions
- More regions
Manual planning does not scale.
Business impact: Planning cost rises, reaction time slows, and risk increases.
Level 2 — Automated Forecasting (System Baseline)
The retailer invests in a forecasting platform.
The system incorporates:
- Historical sales
- Seasonality patterns
- Promotion history
- Price history
What Is Seasonality?
Hoodies sell more when fall begins.
If average weekly hoodie sales are:
- 60 during summer
- 78 during early fall
Seasonality factor = 78 / 60 = 1.30, Demand in fall is 30% higher.
What Is Promo Uplift?
If hoodies normally sell 80 units but sell 92 during 20% discount weeks:
- Promo uplift = 15%
Press enter or click to view image in full size
Weekly Forecast Output
| Step | Units per Store |
|---|---|
| Baseline (last year) | 80 |
| Apply seasonality (x1.30) | 104 |
| Apply prompt uplift (x1.15) | 120 |
Forecast = 120 units per store
Total = 12,000 units
What This Solves?
- Scales planning across thousands of SKUs
- Reduces manual workload
- Improves consistency
What It Introduces?
Forecast confidence increases buying scale.
- If forecast error happens to be at 15% on 12,000 units, that’s 1,800 units misaligned.
In apparel, that becomes:
- Overstock → markdown losses
- Understock → lost revenue
Net Business Impact, Automation amplifies financial exposure.
Level 3 — Probabilistic Forecasting (Uncertainty Becomes Visible)
Instead of one number, the system provides a range.
| Scenario | Units per Store | Total units |
|---|---|---|
| Low (P10) | 100 | 10,000 |
| Most Likely (P50) | 120 | 12,000 |
| High (P90) | 145 | 14,500 |
What This Solves?
- Makes uncertainty explicit
- Enables risk-based planning
- Supports better working capital modeling
What It Introduces?
The forecast is no longer the decision.
- Sales may push for 145.
- Finance may push for 100.
- Supply chain may focus on feasibility.
The problem shifts from: “Is the forecast accurate?” to “What is our business risk posture?”
Level 4 — Integrated Business Planning (Feasible Execution)
Now operational constraints enter.
| Constraint | Value |
|---|---|
| DC Capacity | 8,000 Units |
| Unit Cost | $40 |
| Cash Available | $420,000 |
| Vendor MOQ | 10,000 Units |
- Most likely Forecast calls for 12,000 units.
- DC capacity is only 8,000.
Final feasible allocation = 8,000 units (80 per store).
What This Solves?
- Aligns demand with operational reality
- Protects cash
- Prevents warehouse overload
Now the Critical Gap and Business Impact?
Suppose demand was stronger than expected.
- Observed sales per store = 80 (sold out).
- Estimated true demand = 120 per store.
- Lost units = 40 per store
- Total lost units = 4,000
Assume:
Retail price = $60
Cost = $40
Margin per unit = $20
Lost gross margin = $80,000
The capacity constraint was real. The decision was rational.
But the organization cannot systematically answer:
- How often are capacity constraints costing us margin
- Should we expand capacity for high-confidence SKUs
- Should allocation logic change during peak season?
Unfortunate reality is organization makes all these decisions today but the reasoning lives in meeting notes, emails, slacks, teams etc. Net Business Impact is Organization never learn from their decisions and this happens to be a classic institutional memory loss.
Level 5 — Intelligent Enterprise (Signal → Policy → Action → Outcome → Learning)
From Forecasting to Self-Improving Execution
Up to Level 4, the enterprise coordinates.
- It forecasts demand.
- It aligns finance.
- It respects operational constraints.
But it still loses something critical:
- Institutional memory.
The organization makes thousands of decisions every season — but very few of those decisions become structured knowledge that improves the next one. Level 5 solves this. Not by adding another dashboard, But by redesigning how decisions are represented, executed, and learned from.
Level 5 formalizes this loop:
- Signal → Policy → Action → Outcome → Learning
But unlike earlier levels, this loop is embedded directly into the operational architecture of the enterprise.
Going back to our hoodie example.
Step 1 — Create a Shared Operational Language (Ontology)
The first requirement is not AI. It is structure.
The enterprise must define its core operational objects:
- SKU
- Store
- Forecast
- Capacity
- Cash Constraint
- Allocation
- Margin
- Policy
- Decision
- Outcome
- …
Instead of these living in different systems with different definitions, they are represented inside a unified business ontology.
An ontology is simply a structured model of how the business works.
For example:
A “Forecast” object is linked to:
- SKU
- Store cluster
- Time period
- Confidence band
A “Capacity Constraint” object is linked to:
- Distribution center
- Week
- Throughput limit
- …
A “Decision” object is linked to:
- Forecast
- Policy
- Constraint
- Action taken
- Approver (if any)
- …
Now every operational action references the same business model.
- No more spreadsheet logic silos.
- No more conflicting definitions.
- No more rehashing the same decisions over and over again due to Institutional memory loss
This is the foundation for intelligence.
Step 2 — Connect Objects Through a Knowledge Graph
Once core business objects are defined, they are connected.
SKU → Store → Demand → Allocation → Capacity → Margin → Cash → Outcome
This interconnected structure forms a knowledge graph. The graph allows the system to understand relationships.
For example:
If hoodie demand increases, and hoodie margin is high, and DC capacity is constrained, then the graph reveals which SKUs compete for the same capacity.
The system does not just see numbers. It understands context.
Step 3 — Embed Policy as Code (Decision Intelligence Layer)
Now governance is formalized.
Instead of debating risk in meetings, policies are encoded explicitly:
- If forecast confidence > 80% and margin > 50%, prioritize allocation.
- If expected lost margin > $50,000, escalate.
- If allocation change < 5%, auto-approve.
These are not informal agreements. They are machine-executable policies. This creates a Decision Intelligence layer.
- When demand shifts mid-week, the system:
Recomputes forecast. - Evaluates constraints.
- Applies policies.
- Determines whether to auto-execute or escalate.
No manual coordination required for small moves.
Only true exceptions reach humans.
Step 4 — AI-Enabled Operational Workflows
Now we move beyond dashboards. When the system detects that hoodie demand is accelerating:
- It does not generate a report.
- It triggers a workflow.
For example:
- Recommend reallocating 3% inventory from low-demand regions.
- Check DC surge capacity.
- Simulate financial impact.
- Generate supplier expedite option.
If within policy bounds, it executes.
If outside bounds, it presents a structured recommendation with full context.
This is AI embedded directly into the operational workflow — not as a side analysis tool. The enterprise moves from passive analytics to active execution.
Step 5 — Capture Decision Exhaust Structurally
This is the most critical layer.
Every action becomes a structured decision record:
- Decision ID
- Forecast context
- Policy triggered
- Constraint binding
- Action taken
- Expected margin impact
- Actual outcome
- ….
After the season:
If the hoodie lost $80,000 due to capacity constraints, the system knows:
- Which constraint bound?
- What forecast confidence was?
- What margin profile existed?
- What policy was applied?
This is no longer anecdotal memory.
- It becomes training data.
Step 6 — Continuous Learning Across the Enterprise
Now AI can learn patterns such as:
- High-confidence SKUs constrained by DC capacity repeatedly cause margin loss.
- Conservative risk posture during peak season underperforms.
- Certain vendors consistently miss surge demand windows.
The system can then recommend structural improvements:
- Increase surge capacity during high-confidence weeks.
- Adjust risk policy dynamically.
- Pre-allocate margin-priority SKUs.
The enterprise becomes self-improving. Not because the forecast got smarter. But because the organization’s decisions became data.
What Makes This Self Improving and Autonomous?
At Level 5:
- Small allocation shifts happen automatically.
- Cross-functional coordination is embedded in policy.
- Only true strategic exceptions require human involvement.
- Every decision improves the next one.
This is not replacing humans but moving humans to supervisory and strategic roles.
The enterprise operates at machine speed — but within defined governance.
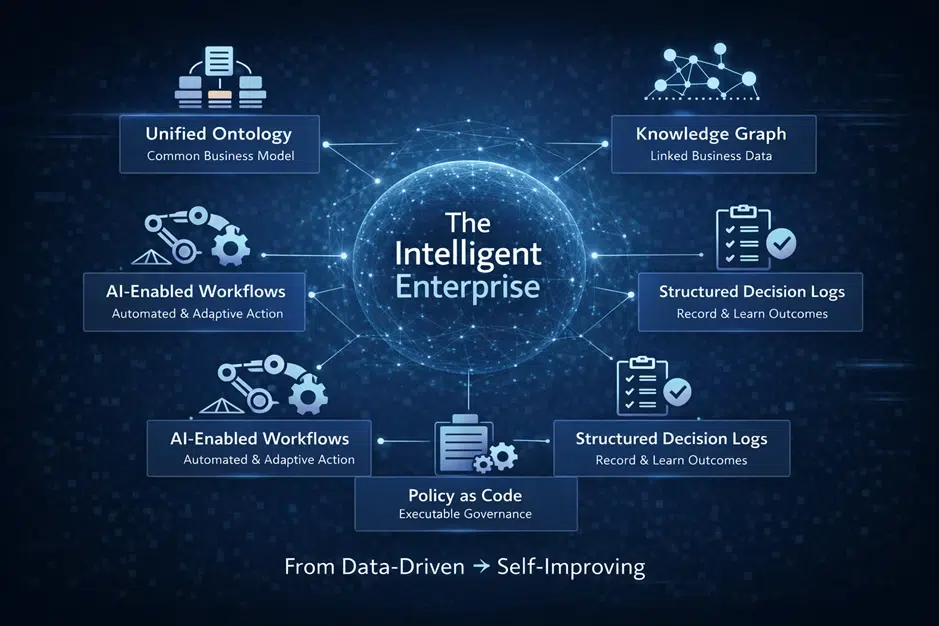
What are the Architectural Components Required?
To achieve this, the enterprise needs:
- A unified business ontology (shared operational model).
- A knowledge graph connecting business objects.
- Policy-as-code (machine-executable governance).
- AI-enabled operational workflows.
- Structured decision logging (decision exhaust capture).
- Feedback loops that retrain models based on real outcomes.
Without these components, business processes like demand planning remains isolated.
With them, demand planning as an example becomes the trigger for intelligent execution.
Now, The Real Difference Between Automation and Intelligence
- Automation executes tasks.
- Intelligence improves decisions over time.
Level 5 is not about better prediction.
It is about:
- Representing the enterprise structurally.
- Embedding governance into workflows.
- Converting decisions into reusable knowledge.
- Allowing AI to operate within mission-critical processes safely.
This is the shift from: Data-driven enterprise to Self-improving enterprise. And that is what true Intelligent Enterprise looks like.

Kumar Raman is the Chief Product and Technology Officer with over 20 years of experience in Data, Analytics, and AI leadership. He specializes in shaping AI-driven data strategies, modern architectures, and large-scale transformation initiatives that deliver measurable business outcomes. Kumar has led multimillion-dollar programs, modernizing data platforms and embedding AI into enterprise decision-making. He is also a trusted advisor to executive leadership, helping organizations accelerate their journey toward intelligent, AI-powered operations.